Southern Boobook
Ninox boobook
ABR description
The following is extracted from the Annual Bird Report for the twelve months to June 2017.
Common, breeding resident
The most numerous of our local owls, heard more often than seen in the suburbs. In serious decline nationally, according to BirdLife Australia (2015).
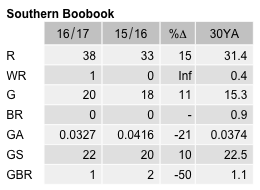
General: 45 records, all single birds except for 2/15 Mar O’Connor (MiP1). From 24 mainly urban grid cells. The reporting rate of 0.3%, while the same as last year, is well below the 30YA of 1.2%. Recorded in 26 weeks: winter 11%; spring 38%; summer 27% and autumn 24%.
GBS: 78 records, at a reporting rate of 3.0% compared with a long-term average of 3.4%. The abundance value of A=0.0327 is holding up reasonably well against the long-term average of A=0.0374. Mainly single birds. Max 3/1 Jan Burra GrM20 (AnI1). Recorded over 34 weeks, with 6% of records in winter, 30% spring,42% summer and 22% autumn. From 13 grid cells; relatively common only in Cook and Ainslie. One possible breeding record: ih/28 Aug Watson GrL12 (WaK1), where boobooks have bred before.
Abundance
Abundance is the average number of birds of that species per survey. Where the species was observed (presence recorded) but the number of birds seen was not recorded, this is treated as a count of zero.
Abundance by year
This chart shows the abundance of Southern Boobook between 1982 and 2017. 
Abundance by month
This chart shows the monthly abundance of Southern Boobook. The blue lines show the abundance for the twelve months to June 2017 and the bars show the average abundance for the period 1982 to 2017. 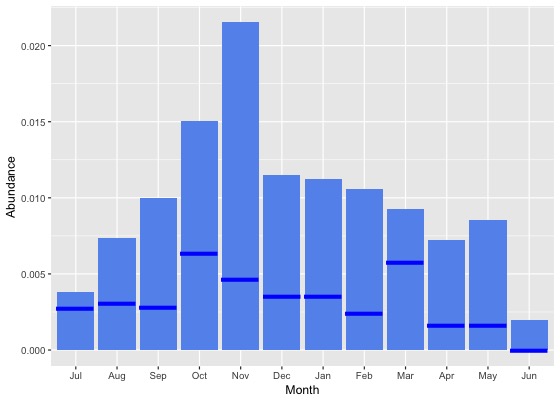
Abundance by season
This chart shows the seasonal abundance of Southern Boobook. The blue lines show the seasonal abundance for the twelve months to June 2017 and the bars show the average seasonal abundance for the period 1982 to 2017. 
Abundance data
| Month | Season | ||||||||||||||||||
|---|---|---|---|---|---|---|---|---|---|---|---|---|---|---|---|---|---|---|---|
| Period | Jul | Aug | Sep | Oct | Nov | Dec | Jan | Feb | Mar | Apr | May | Jun | Winter | Spring | Summer | Autumn | All | ||
| All years | |||||||||||||||||||
| All | 0.0 | 0.0 | 0.0 | 0.0 | 0.0 | 0.0 | 0.0 | 0.0 | 0.0 | 0.0 | 0.0 | 0.0 | 0.0 | 0.0 | 0.0 | 0.0 | 0.0 | ||
| Previous years | |||||||||||||||||||
| All previous years | 0.0 | 0.0 | 0.0 | 0.0 | 0.0 | 0.0 | 0.0 | 0.0 | 0.0 | 0.0 | 0.0 | 0.0 | 0.0 | 0.0 | 0.0 | 0.0 | 0.0 | ||
| Previous 30 years | 0.0 | 0.0 | 0.0 | 0.0 | 0.0 | 0.0 | 0.0 | 0.0 | 0.0 | 0.0 | 0.0 | 0.0 | 0.0 | 0.0 | 0.0 | 0.0 | 0.0 | ||
| Previous 20 years | 0.0 | 0.0 | 0.0 | 0.0 | 0.0 | 0.0 | 0.0 | 0.0 | 0.0 | 0.0 | 0.0 | 0.0 | 0.0 | 0.0 | 0.0 | 0.0 | 0.0 | ||
| 10 year groups | |||||||||||||||||||
| [2007,2017) | 0.0 | 0.0 | 0.0 | 0.0 | 0.0 | 0.0 | 0.0 | 0.0 | 0.0 | 0.0 | 0.0 | 0.0 | 0.0 | 0.0 | 0.0 | 0.0 | 0.0 | ||
| [1997,2007) | 0.0 | 0.0 | 0.0 | 0.0 | 0.0 | 0.0 | 0.0 | 0.0 | 0.0 | 0.0 | 0.0 | 0.0 | 0.0 | 0.0 | 0.0 | 0.0 | 0.0 | ||
| [1987,1997) | 0.0 | 0.0 | 0.0 | 0.1 | 0.1 | 0.1 | 0.0 | 0.0 | 0.0 | 0.0 | 0.0 | 0.0 | 0.0 | 0.1 | 0.0 | 0.0 | 0.0 | ||
| 5 year groups | |||||||||||||||||||
| [2012,2017) | 0.0 | 0.0 | 0.0 | 0.0 | 0.0 | 0.0 | 0.0 | 0.0 | 0.0 | 0.0 | 0.0 | 0.0 | 0.0 | 0.0 | 0.0 | 0.0 | 0.0 | ||
| [2007,2012) | 0.0 | 0.0 | 0.0 | 0.0 | 0.0 | 0.0 | 0.0 | 0.0 | 0.0 | 0.0 | 0.0 | 0.0 | 0.0 | 0.0 | 0.0 | 0.0 | 0.0 | ||
| [2002,2007) | 0.0 | 0.0 | 0.0 | 0.0 | 0.0 | 0.0 | 0.0 | 0.0 | 0.0 | 0.0 | 0.0 | 0.0 | 0.0 | 0.0 | 0.0 | 0.0 | 0.0 | ||
| [1997,2002) | 0.0 | 0.0 | 0.0 | 0.0 | 0.0 | 0.0 | 0.0 | 0.0 | 0.0 | 0.0 | 0.0 | 0.0 | 0.0 | 0.0 | 0.0 | 0.0 | 0.0 | ||
| [1992,1997) | 0.0 | 0.0 | 0.0 | 0.0 | 0.0 | 0.0 | 0.0 | 0.0 | 0.0 | 0.0 | 0.0 | 0.0 | 0.0 | 0.0 | 0.0 | 0.0 | 0.0 | ||
| [1987,1992) | 0.0 | 0.0 | 0.0 | 0.1 | 0.1 | 0.1 | 0.1 | 0.0 | 0.1 | 0.0 | 0.0 | 0.0 | 0.0 | 0.1 | 0.1 | 0.0 | 0.0 | ||
| Year | |||||||||||||||||||
| 2017 | 0.0 | 0.0 | 0.0 | 0.0 | 0.0 | 0.0 | 0.0 | 0.0 | 0.0 | 0.0 | 0.0 | 0.0 | 0.0 | 0.0 | 0.0 | 0.0 | 0.0 | ||
| 2016 | 0.0 | 0.0 | 0.0 | 0.0 | 0.0 | 0.0 | 0.0 | 0.0 | 0.0 | 0.0 | 0.0 | 0.0 | 0.0 | 0.0 | 0.0 | 0.0 | 0.0 | ||
| 2015 | 0.0 | 0.0 | 0.0 | 0.0 | 0.0 | 0.0 | 0.0 | 0.0 | 0.0 | 0.0 | 0.0 | 0.0 | 0.0 | 0.0 | 0.0 | 0.0 | 0.0 | ||
| 2014 | 0.0 | 0.0 | 0.0 | 0.0 | 0.0 | 0.0 | 0.0 | 0.0 | 0.0 | 0.0 | 0.0 | 0.0 | 0.0 | 0.0 | 0.0 | 0.0 | 0.0 | ||
| 2013 | 0.0 | 0.0 | 0.0 | 0.0 | 0.0 | 0.0 | 0.0 | 0.0 | 0.0 | 0.0 | 0.0 | 0.0 | 0.0 | 0.0 | 0.0 | 0.0 | 0.0 | ||
| 2012 | 0.0 | 0.0 | 0.0 | 0.0 | 0.0 | 0.0 | 0.0 | 0.0 | 0.0 | 0.0 | 0.0 | 0.0 | 0.0 | 0.0 | 0.0 | 0.0 | 0.0 | ||
| 2011 | 0.0 | 0.0 | 0.0 | 0.0 | 0.0 | 0.0 | 0.0 | 0.0 | 0.0 | 0.0 | 0.0 | 0.0 | 0.0 | 0.0 | 0.0 | 0.0 | 0.0 | ||
| 2010 | 0.0 | 0.0 | 0.0 | 0.0 | 0.0 | 0.0 | 0.0 | 0.0 | 0.0 | 0.0 | 0.0 | 0.0 | 0.0 | 0.0 | 0.0 | 0.0 | 0.0 | ||
| 2009 | 0.0 | 0.0 | 0.0 | 0.0 | 0.0 | 0.0 | 0.0 | 0.0 | 0.0 | 0.0 | 0.0 | 0.0 | 0.0 | 0.0 | 0.0 | 0.0 | 0.0 | ||
| 2008 | 0.0 | 0.0 | 0.0 | 0.0 | 0.0 | 0.0 | 0.0 | 0.0 | 0.0 | 0.0 | 0.0 | 0.0 | 0.0 | 0.0 | 0.0 | 0.0 | 0.0 | ||
| 2007 | 0.0 | 0.0 | 0.0 | 0.0 | 0.0 | 0.0 | 0.0 | 0.0 | 0.0 | 0.0 | 0.0 | 0.0 | 0.0 | 0.0 | 0.0 | 0.0 | 0.0 | ||
| 2006 | 0.0 | 0.0 | 0.0 | 0.0 | 0.0 | 0.0 | 0.0 | 0.0 | 0.0 | 0.0 | 0.0 | 0.0 | 0.0 | 0.0 | 0.0 | 0.0 | 0.0 | ||
| 2005 | 0.0 | 0.0 | 0.0 | 0.0 | 0.0 | 0.0 | 0.0 | 0.0 | 0.0 | 0.0 | 0.0 | 0.0 | 0.0 | 0.0 | 0.0 | 0.0 | 0.0 | ||
| 2004 | 0.0 | 0.0 | 0.0 | 0.0 | 0.0 | 0.0 | 0.0 | 0.0 | 0.0 | 0.0 | 0.0 | 0.0 | 0.0 | 0.0 | 0.0 | 0.0 | 0.0 | ||
| 2003 | 0.0 | 0.0 | 0.0 | 0.0 | 0.0 | 0.0 | 0.0 | 0.0 | 0.0 | 0.0 | 0.0 | 0.0 | 0.0 | 0.0 | 0.0 | 0.0 | 0.0 | ||
| 2002 | 0.0 | 0.0 | 0.0 | 0.0 | 0.0 | 0.0 | 0.0 | 0.0 | 0.0 | 0.0 | 0.0 | 0.0 | 0.0 | 0.0 | 0.0 | 0.0 | 0.0 | ||
| 2001 | 0.0 | 0.0 | 0.0 | 0.0 | 0.0 | 0.0 | 0.0 | 0.0 | 0.0 | 0.0 | 0.0 | 0.0 | 0.0 | 0.0 | 0.0 | 0.0 | 0.0 | ||
| 2000 | 0.0 | 0.0 | 0.0 | 0.0 | 0.0 | 0.0 | 0.0 | 0.0 | 0.0 | 0.0 | 0.0 | 0.0 | 0.0 | 0.0 | 0.0 | 0.0 | 0.0 | ||
| 1999 | 0.0 | 0.0 | 0.0 | 0.0 | 0.0 | 0.0 | 0.0 | 0.0 | 0.0 | 0.0 | 0.0 | 0.0 | 0.0 | 0.0 | 0.0 | 0.0 | 0.0 | ||
| 1998 | 0.0 | 0.0 | 0.0 | 0.0 | 0.0 | 0.0 | 0.0 | 0.0 | 0.0 | 0.0 | 0.0 | 0.0 | 0.0 | 0.0 | 0.0 | 0.0 | 0.0 | ||
| 1997 | 0.0 | 0.0 | 0.0 | 0.0 | 0.0 | 0.0 | 0.0 | 0.1 | 0.0 | 0.0 | 0.0 | 0.0 | 0.0 | 0.0 | 0.0 | 0.0 | 0.0 | ||
| 1996 | 0.0 | 0.1 | 0.0 | 0.0 | 0.0 | 0.0 | 0.1 | 0.0 | 0.0 | 0.0 | 0.1 | 0.0 | 0.0 | 0.0 | 0.0 | 0.0 | 0.0 | ||
| 1995 | 0.0 | 0.0 | 0.0 | 0.0 | 0.0 | 0.0 | 0.0 | 0.0 | 0.0 | 0.0 | 0.0 | 0.0 | 0.0 | 0.0 | 0.0 | 0.0 | 0.0 | ||
| 1994 | 0.0 | 0.0 | 0.0 | 0.0 | 0.0 | 0.0 | 0.0 | 0.0 | 0.0 | 0.0 | 0.0 | 0.0 | 0.0 | 0.0 | 0.0 | 0.0 | 0.0 | ||
| 1993 | 0.0 | 0.0 | 0.0 | 0.0 | 0.0 | 0.0 | 0.1 | 0.0 | 0.0 | 0.1 | 0.0 | 0.0 | 0.0 | 0.0 | 0.0 | 0.0 | 0.0 | ||
| 1992 | 0.0 | 0.0 | 0.0 | 0.1 | 0.1 | 0.0 | 0.0 | 0.0 | 0.0 | 0.0 | 0.0 | 0.0 | 0.0 | 0.1 | 0.0 | 0.0 | 0.0 | ||
| 1991 | 0.0 | 0.0 | 0.2 | 0.2 | 0.1 | 0.1 | 0.1 | 0.1 | 0.1 | 0.1 | 0.0 | 0.0 | 0.0 | 0.1 | 0.1 | 0.1 | 0.1 | ||
| 1990 | 0.0 | 0.0 | 0.0 | 0.0 | 0.1 | 0.1 | 0.0 | 0.0 | 0.0 | 0.0 | 0.0 | 0.0 | 0.0 | 0.0 | 0.0 | 0.0 | 0.0 | ||
| 1989 | 0.0 | 0.0 | 0.1 | 0.1 | 0.2 | 0.1 | 0.0 | 0.1 | 0.1 | 0.0 | 0.0 | 0.0 | 0.0 | 0.1 | 0.1 | 0.0 | 0.1 | ||
| 1988 | 0.0 | 0.0 | 0.0 | 0.1 | 0.2 | 0.1 | 0.1 | 0.0 | 0.0 | 0.0 | 0.0 | 0.0 | 0.0 | 0.1 | 0.1 | 0.0 | 0.1 | ||
| 1987 | 0.1 | 0.0 | 0.0 | 0.0 | 0.0 | 0.0 | 0.1 | 0.0 | 0.0 | 0.0 | 0.0 | 0.0 | 0.0 | 0.0 | 0.0 | 0.0 | 0.0 | ||
| 1986 | 0.0 | 0.0 | 0.0 | 0.0 | 0.0 | 0.0 | 0.0 | 0.0 | 0.0 | 0.0 | 0.0 | 0.0 | 0.0 | 0.0 | 0.0 | 0.0 | 0.0 | ||
| 1985 | 0.0 | 0.0 | 0.0 | 0.0 | 0.0 | 0.0 | 0.0 | 0.0 | 0.0 | 0.0 | 0.0 | 0.0 | 0.0 | 0.0 | 0.0 | 0.0 | 0.0 | ||
| 1984 | 0.0 | 0.0 | 0.0 | 0.0 | 0.0 | 0.0 | 0.0 | 0.0 | 0.0 | 0.0 | 0.0 | 0.0 | 0.0 | 0.0 | 0.0 | 0.0 | 0.0 | ||
| 1983 | 0.0 | 0.0 | 0.0 | 0.0 | 0.0 | 0.0 | 0.0 | 0.0 | 0.0 | - | 0.0 | 0.0 | 0.0 | 0.0 | 0.0 | 0.0 | 0.0 | ||
| 1982 | - | 0.0 | - | 0.0 | 0.0 | 0.0 | - | 0.0 | - | 0.0 | - | 0.0 | 0.0 | 0.0 | 0.0 | 0.0 | 0.0 | ||
Reporting rates
Reporting rate is the proportion of all surveys in which the species was present.
Reporting rate by year
This chart shows the reporting rate of Southern Boobook each year between 1982 and 2017. 
Reporting rate by month
This chart shows the reporting rate by month of Southern Boobook. The blue lines show the reporting rate for the twelve months to June 2017 and the bars show the average reporting rate for the period 1982 to 2017. 
Reporting rate by season
This chart shows the seasonal reporting rate of Southern Boobook. The blue lines show the seasonal reporting rate for the twelve months to June 2017 and the bars show the average seasonal reporting rate for the period 1982 to 2017. 
Reporting rate data
| Month | Season | ||||||||||||||||||
|---|---|---|---|---|---|---|---|---|---|---|---|---|---|---|---|---|---|---|---|
| Period | Jul | Aug | Sep | Oct | Nov | Dec | Jan | Feb | Mar | Apr | May | Jun | Winter | Spring | Summer | Autumn | All | ||
| All years | |||||||||||||||||||
| All | 0.4 | 0.8 | 1.0 | 1.4 | 2.2 | 1.1 | 1.0 | 1.0 | 1.0 | 0.8 | 0.9 | 0.2 | 0.5 | 1.5 | 1.0 | 0.9 | 1.0 | ||
| Previous years | |||||||||||||||||||
| All previous years | 0.5 | 0.9 | 1.1 | 1.5 | 2.5 | 1.2 | 1.1 | 1.1 | 1.1 | 0.9 | 1.0 | 0.3 | 0.5 | 1.7 | 1.1 | 1.0 | 1.1 | ||
| Previous 30 years | 0.5 | 0.9 | 1.1 | 1.6 | 2.5 | 1.3 | 1.1 | 1.1 | 1.1 | 0.9 | 1.0 | 0.3 | 0.5 | 1.7 | 1.2 | 1.0 | 1.2 | ||
| Previous 20 years | 0.4 | 0.5 | 0.7 | 1.0 | 0.9 | 0.6 | 0.6 | 0.8 | 0.6 | 0.6 | 0.7 | 0.2 | 0.4 | 0.9 | 0.7 | 0.6 | 0.7 | ||
| 10 year groups | |||||||||||||||||||
| [2007,2017) | 0.3 | 0.4 | 0.5 | 0.8 | 0.7 | 0.5 | 0.4 | 0.5 | 0.5 | 0.6 | 0.5 | 0.2 | 0.3 | 0.7 | 0.5 | 0.5 | 0.5 | ||
| [1997,2007) | 0.6 | 1.0 | 1.0 | 1.4 | 1.1 | 0.8 | 1.4 | 1.5 | 0.8 | 0.6 | 1.2 | 0.2 | 0.5 | 1.2 | 1.1 | 0.8 | 0.9 | ||
| [1987,1997) | 0.7 | 2.0 | 3.3 | 5.0 | 8.0 | 4.9 | 3.6 | 2.8 | 3.9 | 2.8 | 2.4 | 0.5 | 1.1 | 5.6 | 3.8 | 3.1 | 3.5 | ||
| 5 year groups | |||||||||||||||||||
| [2012,2017) | 0.4 | 0.3 | 0.5 | 0.6 | 0.7 | 0.4 | 0.4 | 0.4 | 0.5 | 0.6 | 0.3 | 0.3 | 0.3 | 0.6 | 0.4 | 0.5 | 0.5 | ||
| [2007,2012) | 0.0 | 0.7 | 0.7 | 1.2 | 0.9 | 0.8 | 0.5 | 0.6 | 0.6 | 0.4 | 0.8 | 0.1 | 0.2 | 1.0 | 0.6 | 0.6 | 0.7 | ||
| [2002,2007) | 0.4 | 0.2 | 0.9 | 1.3 | 0.9 | 0.6 | 0.5 | 0.8 | 0.4 | 0.1 | 0.6 | 0.0 | 0.2 | 1.0 | 0.6 | 0.4 | 0.6 | ||
| [1997,2002) | 1.0 | 1.9 | 1.0 | 1.6 | 1.4 | 1.1 | 2.3 | 2.3 | 1.3 | 1.3 | 1.9 | 0.4 | 1.0 | 1.3 | 1.8 | 1.5 | 1.4 | ||
| [1992,1997) | 0.6 | 0.9 | 1.0 | 1.7 | 1.6 | 1.8 | 1.3 | 0.7 | 1.6 | 1.6 | 1.4 | 0.3 | 0.6 | 1.5 | 1.3 | 1.5 | 1.2 | ||
| [1987,1992) | 0.7 | 2.5 | 4.4 | 6.9 | 11.1 | 6.3 | 4.9 | 3.6 | 5.3 | 3.5 | 2.9 | 0.6 | 1.3 | 7.7 | 5.0 | 3.9 | 4.7 | ||
| Year | |||||||||||||||||||
| 2017 | 0.3 | 0.3 | 0.3 | 0.6 | 0.5 | 0.4 | 0.4 | 0.2 | 0.5 | 0.2 | 0.2 | 0.0 | 0.2 | 0.5 | 0.3 | 0.3 | 0.3 | ||
| 2016 | 0.3 | 0.0 | 0.6 | 0.5 | 0.3 | 0.2 | 0.3 | 0.3 | 0.5 | 0.1 | 0.0 | 0.0 | 0.1 | 0.5 | 0.3 | 0.2 | 0.3 | ||
| 2015 | 0.7 | 0.2 | 0.4 | 0.4 | 0.2 | 0.3 | 0.6 | 0.7 | 0.7 | 0.8 | 0.5 | 0.9 | 0.7 | 0.3 | 0.5 | 0.7 | 0.5 | ||
| 2014 | 0.6 | 0.0 | 0.5 | 0.8 | 0.7 | 0.4 | 0.6 | 0.2 | 0.6 | 1.3 | 0.7 | 0.0 | 0.1 | 0.7 | 0.4 | 0.9 | 0.6 | ||
| 2013 | 0.0 | 0.5 | 0.2 | 0.5 | 2.1 | 0.7 | 0.2 | 0.6 | 0.2 | 0.9 | 0.0 | 0.0 | 0.1 | 0.8 | 0.5 | 0.4 | 0.5 | ||
| 2012 | 0.4 | 1.2 | 0.5 | 1.1 | 1.1 | 0.8 | 0.4 | 0.5 | 0.6 | 0.8 | 1.1 | 0.0 | 0.5 | 0.9 | 0.5 | 0.8 | 0.7 | ||
| 2011 | 0.0 | 0.8 | 0.8 | 1.0 | 0.6 | 0.3 | 0.3 | 1.4 | 1.2 | 0.6 | 1.8 | 0.0 | 0.2 | 0.9 | 0.6 | 1.2 | 0.8 | ||
| 2010 | 0.0 | 0.0 | 0.7 | 0.4 | 1.0 | 0.4 | 0.0 | 0.0 | 0.4 | 1.3 | 0.0 | 0.0 | 0.0 | 0.6 | 0.2 | 0.7 | 0.4 | ||
| 2009 | 0.0 | 0.0 | 0.8 | 2.6 | 0.4 | 0.0 | 0.7 | 0.0 | 0.5 | 0.0 | 0.0 | 0.5 | 0.2 | 1.6 | 0.2 | 0.2 | 0.8 | ||
| 2008 | 0.0 | 1.7 | 0.4 | 0.5 | 2.7 | 2.3 | 0.0 | 0.9 | 0.5 | 0.0 | 0.9 | 0.5 | 0.6 | 0.8 | 1.3 | 0.3 | 0.7 | ||
| 2007 | 0.0 | 0.9 | 0.8 | 1.4 | 0.0 | 1.0 | 1.2 | 0.0 | 0.0 | 0.4 | 0.0 | 0.0 | 0.2 | 1.0 | 0.9 | 0.2 | 0.6 | ||
| 2006 | 0.0 | 0.0 | 0.4 | 0.3 | 0.6 | 0.6 | 0.6 | 1.5 | 0.9 | 0.0 | 0.0 | 0.0 | 0.0 | 0.4 | 0.8 | 0.5 | 0.4 | ||
| 2005 | 0.0 | 0.0 | 0.7 | 2.2 | 0.0 | 0.4 | 0.0 | 0.0 | 0.0 | 0.5 | 0.5 | 0.0 | 0.0 | 1.0 | 0.2 | 0.3 | 0.4 | ||
| 2004 | 0.8 | 0.0 | 1.0 | 1.7 | 1.2 | 0.9 | 1.2 | 1.0 | 0.0 | 0.0 | 0.0 | 0.0 | 0.4 | 1.3 | 1.0 | 0.0 | 0.7 | ||
| 2003 | 0.0 | 0.0 | 0.0 | 0.5 | 1.8 | 1.3 | 0.0 | 0.5 | 0.4 | 0.0 | 2.3 | 0.0 | 0.0 | 0.8 | 0.7 | 0.7 | 0.6 | ||
| 2002 | 0.6 | 0.8 | 2.5 | 2.6 | 0.5 | 0.0 | 0.6 | 0.7 | 0.5 | 0.0 | 0.0 | 0.0 | 0.4 | 1.9 | 0.3 | 0.2 | 0.8 | ||
| 2001 | 1.3 | 3.6 | 2.1 | 1.3 | 0.6 | 1.8 | 1.0 | 1.5 | 0.6 | 0.5 | 2.3 | 0.5 | 1.7 | 1.5 | 1.5 | 1.0 | 1.4 | ||
| 2000 | 0.8 | 1.3 | 0.5 | 2.2 | 1.9 | 1.7 | 2.9 | 1.9 | 3.3 | 3.5 | 3.6 | 0.0 | 0.6 | 1.5 | 2.1 | 3.4 | 2.0 | ||
| 1999 | 0.0 | 0.0 | 0.0 | 0.6 | 0.6 | 0.0 | 4.4 | 2.1 | 1.1 | 0.5 | 1.1 | 0.5 | 0.3 | 0.4 | 2.1 | 0.9 | 0.9 | ||
| 1998 | 0.0 | 1.9 | 1.6 | 2.2 | 3.5 | 0.0 | 0.0 | 0.0 | 0.0 | 0.0 | 0.0 | 0.0 | 0.6 | 2.4 | 0.0 | 0.0 | 1.0 | ||
| 1997 | 1.1 | 1.7 | 0.0 | 2.6 | 0.9 | 0.0 | 2.0 | 8.8 | 0.0 | 0.0 | 0.0 | 1.4 | 1.4 | 1.0 | 2.8 | 0.0 | 1.3 | ||
| 1996 | 0.0 | 3.2 | 0.0 | 0.9 | 0.9 | 1.0 | 1.9 | 1.2 | 0.0 | 1.6 | 5.2 | 0.0 | 1.2 | 0.7 | 1.4 | 1.8 | 1.2 | ||
| 1995 | 0.0 | 0.0 | 1.0 | 1.2 | 2.7 | 3.4 | 0.9 | 0.0 | 1.0 | 0.8 | 2.6 | 0.0 | 0.0 | 1.6 | 1.5 | 1.3 | 1.1 | ||
| 1994 | 0.0 | 0.0 | 0.0 | 1.2 | 0.0 | 4.3 | 1.5 | 0.0 | 1.1 | 0.0 | 0.0 | 0.0 | 0.0 | 0.3 | 1.7 | 0.3 | 0.5 | ||
| 1993 | 4.1 | 1.3 | 1.6 | 0.0 | 0.0 | 0.0 | 2.0 | 0.0 | 2.5 | 6.7 | 0.0 | 1.4 | 2.0 | 0.5 | 0.8 | 2.8 | 1.6 | ||
| 1992 | 0.0 | 0.0 | 2.4 | 5.3 | 5.6 | 0.0 | 0.0 | 2.4 | 4.2 | 1.7 | 0.0 | 0.0 | 0.0 | 4.4 | 0.6 | 1.9 | 2.0 | ||
| 1991 | 0.0 | 4.3 | 14.0 | 14.6 | 5.2 | 8.1 | 8.9 | 6.0 | 11.1 | 5.1 | 0.0 | 0.0 | 1.5 | 11.2 | 7.8 | 5.5 | 6.5 | ||
| 1990 | 1.3 | 2.7 | 1.1 | 1.0 | 7.5 | 6.9 | 1.4 | 1.4 | 4.5 | 3.6 | 1.4 | 0.0 | 1.7 | 3.4 | 3.3 | 3.3 | 2.7 | ||
| 1989 | 0.5 | 3.9 | 6.1 | 8.8 | 16.2 | 6.5 | 4.8 | 5.2 | 6.7 | 3.1 | 3.3 | 0.0 | 1.7 | 10.0 | 5.6 | 4.4 | 5.6 | ||
| 1988 | 0.4 | 0.7 | 2.2 | 6.6 | 19.0 | 8.2 | 5.0 | 3.4 | 4.5 | 2.7 | 2.0 | 1.0 | 0.7 | 10.5 | 5.6 | 3.1 | 5.1 | ||
| 1987 | 9.1 | 0.0 | 2.4 | 4.3 | 4.2 | 3.3 | 5.1 | 2.5 | 3.3 | 4.1 | 4.8 | 1.0 | 1.3 | 3.7 | 3.6 | 4.1 | 3.5 | ||
| 1986 | 0.0 | 0.0 | 0.0 | 0.0 | 0.0 | 0.0 | 0.0 | 2.8 | 0.0 | 0.0 | 0.0 | 2.9 | 1.0 | 0.0 | 1.1 | 0.0 | 0.5 | ||
| 1985 | 0.0 | 0.0 | 0.0 | 0.0 | 0.0 | 0.0 | 0.0 | 0.0 | 0.0 | 0.0 | 0.0 | 0.0 | 0.0 | 0.0 | 0.0 | 0.0 | 0.0 | ||
| 1984 | 0.0 | 0.0 | 0.0 | 0.0 | 0.0 | 0.0 | 0.0 | 0.0 | 0.0 | 0.0 | 0.0 | 0.0 | 0.0 | 0.0 | 0.0 | 0.0 | 0.0 | ||
| 1983 | 0.0 | 0.0 | 0.0 | 0.0 | 0.0 | 0.0 | 0.0 | 0.0 | 0.0 | - | 0.0 | 0.0 | 0.0 | 0.0 | 0.0 | 0.0 | 0.0 | ||
| 1982 | - | 0.0 | - | 0.0 | 0.0 | 0.0 | - | 0.0 | - | 0.0 | - | 0.0 | 0.0 | 0.0 | 0.0 | 0.0 | 0.0 | ||
Breeding data
Breeding records by month
Number of breeding records by breeding code and month, 2017 and all years| Breeding code | Jul | Aug | Sep | Oct | Nov | Dec | Jan | Feb | Mar | Apr | May | Jun |
|---|---|---|---|---|---|---|---|---|---|---|---|---|
| 2017 | ||||||||||||
| Breeding (BLA code) | 0 | 0 | 0 | 0 | 0 | 0 | 0 | 0 | 0 | 1 | 0 | 0 |
| Carrying Food | 0 | 0 | 0 | 0 | 0 | 0 | 0 | 0 | 0 | 0 | 0 | 0 |
| Copulating | 0 | 0 | 0 | 0 | 0 | 0 | 0 | 0 | 0 | 0 | 0 | 0 |
| Display | 0 | 0 | 0 | 0 | 0 | 0 | 0 | 0 | 0 | 0 | 0 | 0 |
| Dependent young | 0 | 0 | 0 | 0 | 0 | 0 | 0 | 0 | 0 | 0 | 0 | 0 |
| Faecal sac | 0 | 0 | 0 | 0 | 0 | 0 | 0 | 0 | 0 | 0 | 0 | 0 |
| Inspecting hollow | 0 | 0 | 0 | 0 | 0 | 0 | 0 | 0 | 0 | 0 | 0 | 0 |
| Nest building | 0 | 0 | 0 | 0 | 0 | 0 | 0 | 0 | 0 | 0 | 0 | 0 |
| Nest with eggs | 0 | 0 | 0 | 0 | 0 | 0 | 0 | 0 | 0 | 0 | 0 | 0 |
| Nest with young | 0 | 0 | 0 | 0 | 0 | 0 | 0 | 0 | 0 | 0 | 0 | 0 |
| On/leaving nest | 0 | 0 | 0 | 0 | 0 | 0 | 0 | 0 | 0 | 0 | 0 | 0 |
| All years | ||||||||||||
| Breeding (BLA code) | 0 | 0 | 0 | 0 | 0 | 0 | 3 | 1 | 0 | 1 | 0 | 0 |
| Carrying Food | 0 | 0 | 0 | 0 | 0 | 0 | 0 | 0 | 0 | 0 | 0 | 0 |
| Copulating | 0 | 0 | 0 | 0 | 0 | 0 | 0 | 0 | 0 | 0 | 0 | 0 |
| Display | 0 | 0 | 0 | 0 | 0 | 0 | 0 | 0 | 0 | 0 | 0 | 0 |
| Dependent young | 0 | 0 | 0 | 0 | 1 | 6 | 9 | 4 | 0 | 0 | 0 | 0 |
| Faecal sac | 0 | 0 | 0 | 0 | 0 | 0 | 0 | 0 | 0 | 0 | 0 | 0 |
| Inspecting hollow | 0 | 0 | 0 | 0 | 0 | 0 | 0 | 0 | 0 | 0 | 0 | 0 |
| Nest building | 0 | 0 | 0 | 0 | 0 | 1 | 0 | 0 | 0 | 0 | 0 | 0 |
| Nest with eggs | 0 | 0 | 0 | 0 | 0 | 0 | 0 | 0 | 0 | 0 | 0 | 0 |
| Nest with young | 0 | 0 | 0 | 0 | 1 | 2 | 0 | 0 | 0 | 0 | 0 | 0 |
| On/leaving nest | 0 | 0 | 0 | 0 | 0 | 0 | 0 | 0 | 0 | 0 | 0 | 0 |
Breeding records by year
Average number of breeding records per period by breeding code| Period | Breeding (BLA code) | Carrying Food | Copulating | Display | Dependent young | Faecal sac | Inspecting hollow | Nest building | Nest with eggs | Nest with young | On/leaving nest |
|---|---|---|---|---|---|---|---|---|---|---|---|
| All years | |||||||||||
| All | 0.1 | 0.0 | 0.0 | 0.0 | 0.6 | 0.0 | 0.0 | 0.0 | 0.0 | 0.1 | 0.0 |
| Previous years | |||||||||||
| All previous years | 0.1 | 0.0 | 0.0 | 0.0 | 0.6 | 0.0 | 0.0 | 0.0 | 0.0 | 0.1 | 0.0 |
| Previous 30 years | 0.1 | 0.0 | 0.0 | 0.0 | 0.7 | 0.0 | 0.0 | 0.0 | 0.0 | 0.1 | 0.0 |
| Previous 20 years | 0.2 | 0.0 | 0.0 | 0.0 | 0.5 | 0.0 | 0.0 | 0.0 | 0.0 | 0.0 | 0.0 |
| 10 year groups | |||||||||||
| [2007,2017) | 0.0 | 0.0 | 0.0 | 0.0 | 0.2 | 0.0 | 0.0 | 0.0 | 0.0 | 0.0 | 0.0 |
| [1997,2007) | 0.4 | 0.0 | 0.0 | 0.0 | 0.8 | 0.0 | 0.0 | 0.0 | 0.0 | 0.0 | 0.0 |
| [1987,1997) | 0.0 | 0.0 | 0.0 | 0.0 | 1.0 | 0.0 | 0.0 | 0.1 | 0.0 | 0.3 | 0.0 |
| 5 year groups | |||||||||||
| [2012,2017) | 0.0 | 0.0 | 0.0 | 0.0 | 0.2 | 0.0 | 0.0 | 0.0 | 0.0 | 0.0 | 0.0 |
| [2007,2012) | 0.0 | 0.0 | 0.0 | 0.0 | 0.2 | 0.0 | 0.0 | 0.0 | 0.0 | 0.0 | 0.0 |
| [2002,2007) | 0.0 | 0.0 | 0.0 | 0.0 | 0.6 | 0.0 | 0.0 | 0.0 | 0.0 | 0.0 | 0.0 |
| [1997,2002) | 0.8 | 0.0 | 0.0 | 0.0 | 1.0 | 0.0 | 0.0 | 0.0 | 0.0 | 0.0 | 0.0 |
| [1992,1997) | 0.0 | 0.0 | 0.0 | 0.0 | 1.2 | 0.0 | 0.0 | 0.0 | 0.0 | 0.0 | 0.0 |
| [1987,1992) | 0.0 | 0.0 | 0.0 | 0.0 | 0.8 | 0.0 | 0.0 | 0.2 | 0.0 | 0.6 | 0.0 |
| Year | |||||||||||
| 2017 | 1.0 | 0.0 | 0.0 | 0.0 | 0.0 | 0.0 | 0.0 | 0.0 | 0.0 | 0.0 | 0.0 |
| 2016 | 0.0 | 0.0 | 0.0 | 0.0 | 0.0 | 0.0 | 0.0 | 0.0 | 0.0 | 0.0 | 0.0 |
| 2015 | 0.0 | 0.0 | 0.0 | 0.0 | 0.0 | 0.0 | 0.0 | 0.0 | 0.0 | 0.0 | 0.0 |
| 2014 | 0.0 | 0.0 | 0.0 | 0.0 | 0.0 | 0.0 | 0.0 | 0.0 | 0.0 | 0.0 | 0.0 |
| 2013 | 0.0 | 0.0 | 0.0 | 0.0 | 0.0 | 0.0 | 0.0 | 0.0 | 0.0 | 0.0 | 0.0 |
| 2012 | 0.0 | 0.0 | 0.0 | 0.0 | 1.0 | 0.0 | 0.0 | 0.0 | 0.0 | 0.0 | 0.0 |
| 2011 | 0.0 | 0.0 | 0.0 | 0.0 | 0.0 | 0.0 | 0.0 | 0.0 | 0.0 | 0.0 | 0.0 |
| 2010 | 0.0 | 0.0 | 0.0 | 0.0 | 0.0 | 0.0 | 0.0 | 0.0 | 0.0 | 0.0 | 0.0 |
| 2009 | 0.0 | 0.0 | 0.0 | 0.0 | 0.0 | 0.0 | 0.0 | 0.0 | 0.0 | 0.0 | 0.0 |
| 2008 | 0.0 | 0.0 | 0.0 | 0.0 | 0.0 | 0.0 | 0.0 | 0.0 | 0.0 | 0.0 | 0.0 |
| 2007 | 0.0 | 0.0 | 0.0 | 0.0 | 1.0 | 0.0 | 0.0 | 0.0 | 0.0 | 0.0 | 0.0 |
| 2006 | 0.0 | 0.0 | 0.0 | 0.0 | 1.0 | 0.0 | 0.0 | 0.0 | 0.0 | 0.0 | 0.0 |
| 2005 | 0.0 | 0.0 | 0.0 | 0.0 | 0.0 | 0.0 | 0.0 | 0.0 | 0.0 | 0.0 | 0.0 |
| 2004 | 0.0 | 0.0 | 0.0 | 0.0 | 1.0 | 0.0 | 0.0 | 0.0 | 0.0 | 0.0 | 0.0 |
| 2003 | 0.0 | 0.0 | 0.0 | 0.0 | 0.0 | 0.0 | 0.0 | 0.0 | 0.0 | 0.0 | 0.0 |
| 2002 | 0.0 | 0.0 | 0.0 | 0.0 | 1.0 | 0.0 | 0.0 | 0.0 | 0.0 | 0.0 | 0.0 |
| 2001 | 0.0 | 0.0 | 0.0 | 0.0 | 1.0 | 0.0 | 0.0 | 0.0 | 0.0 | 0.0 | 0.0 |
| 2000 | 0.0 | 0.0 | 0.0 | 0.0 | 1.0 | 0.0 | 0.0 | 0.0 | 0.0 | 0.0 | 0.0 |
| 1999 | 4.0 | 0.0 | 0.0 | 0.0 | 1.0 | 0.0 | 0.0 | 0.0 | 0.0 | 0.0 | 0.0 |
| 1998 | 0.0 | 0.0 | 0.0 | 0.0 | 0.0 | 0.0 | 0.0 | 0.0 | 0.0 | 0.0 | 0.0 |
| 1997 | 0.0 | 0.0 | 0.0 | 0.0 | 2.0 | 0.0 | 0.0 | 0.0 | 0.0 | 0.0 | 0.0 |
| 1996 | 0.0 | 0.0 | 0.0 | 0.0 | 3.0 | 0.0 | 0.0 | 0.0 | 0.0 | 0.0 | 0.0 |
| 1995 | 0.0 | 0.0 | 0.0 | 0.0 | 2.0 | 0.0 | 0.0 | 0.0 | 0.0 | 0.0 | 0.0 |
| 1994 | 0.0 | 0.0 | 0.0 | 0.0 | 0.0 | 0.0 | 0.0 | 0.0 | 0.0 | 0.0 | 0.0 |
| 1993 | 0.0 | 0.0 | 0.0 | 0.0 | 1.0 | 0.0 | 0.0 | 0.0 | 0.0 | 0.0 | 0.0 |
| 1992 | 0.0 | 0.0 | 0.0 | 0.0 | 0.0 | 0.0 | 0.0 | 0.0 | 0.0 | 0.0 | 0.0 |
| 1991 | 0.0 | 0.0 | 0.0 | 0.0 | 0.0 | 0.0 | 0.0 | 0.0 | 0.0 | 0.0 | 0.0 |
| 1990 | 0.0 | 0.0 | 0.0 | 0.0 | 0.0 | 0.0 | 0.0 | 0.0 | 0.0 | 0.0 | 0.0 |
| 1989 | 0.0 | 0.0 | 0.0 | 0.0 | 1.0 | 0.0 | 0.0 | 0.0 | 0.0 | 2.0 | 0.0 |
| 1988 | 0.0 | 0.0 | 0.0 | 0.0 | 2.0 | 0.0 | 0.0 | 1.0 | 0.0 | 1.0 | 0.0 |
| 1987 | 0.0 | 0.0 | 0.0 | 0.0 | 1.0 | 0.0 | 0.0 | 0.0 | 0.0 | 0.0 | 0.0 |
| 1986 | 0.0 | 0.0 | 0.0 | 0.0 | 0.0 | 0.0 | 0.0 | 0.0 | 0.0 | 0.0 | 0.0 |
| 1985 | 0.0 | 0.0 | 0.0 | 0.0 | 0.0 | 0.0 | 0.0 | 0.0 | 0.0 | 0.0 | 0.0 |
| 1984 | 0.0 | 0.0 | 0.0 | 0.0 | 0.0 | 0.0 | 0.0 | 0.0 | 0.0 | 0.0 | 0.0 |
| 1983 | 0.0 | 0.0 | 0.0 | 0.0 | 0.0 | 0.0 | 0.0 | 0.0 | 0.0 | 0.0 | 0.0 |
| 1982 | 0.0 | 0.0 | 0.0 | 0.0 | 0.0 | 0.0 | 0.0 | 0.0 | 0.0 | 0.0 | 0.0 |
Distribution map
Distribution - 2017
This map shows the observed distribution of the Southern Boobook for 2017.
The red circles are the grid cells where Southern Boobook have been reported.
The transparency of the red circles indicate how many surveys sheets were submitted for that grid cell; the darker the red the more reliable the data. Of the 315 grid cells with reports, 83 had only one sheet; an example is grid number U16.
The size of the circle represents the reporting rate. The maximum reporting rate for Southern Boobook was 100.0% (eg grid number U16) and the minimum was 0.1% (eg grid number L14). 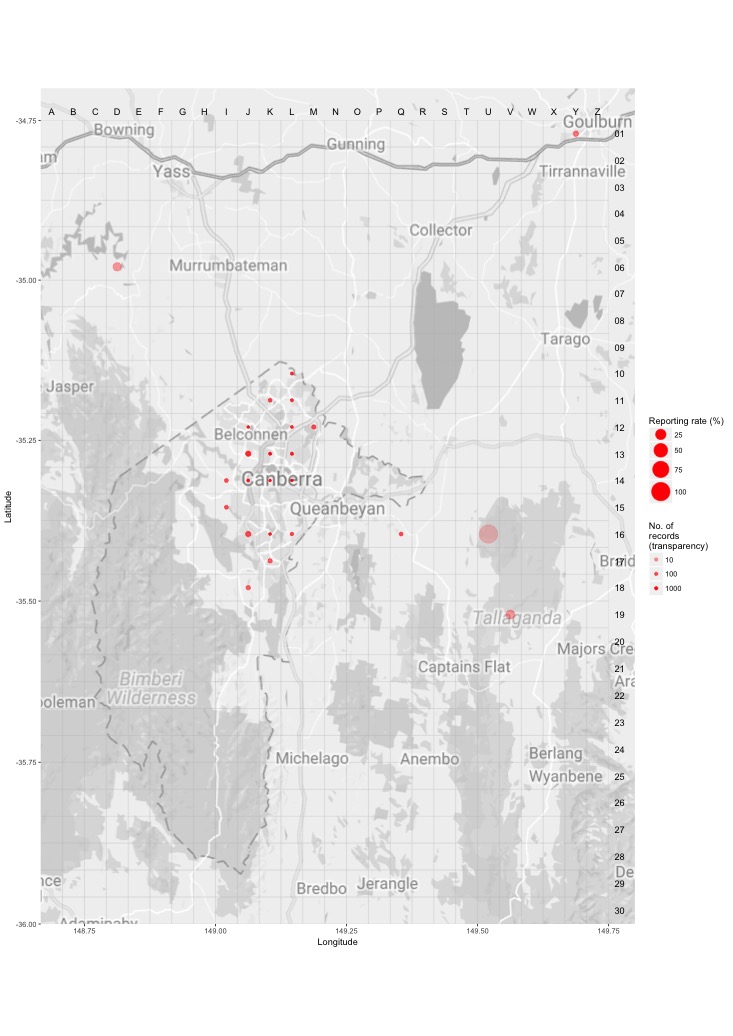
Distribution - all years
This map shows the observed distribution of the Southern Boobook for all years.
The red circles are the grid cells where Southern Boobook have been reported.
The transparency of the red circles indicate how many surveys sheets were submitted for that grid cell; the darker the red the more reliable the data. Of the 703 grid cells with reports, 55 had only one sheet; an example is grid number V27.
The size of the circle represents the reporting rate. The maximum reporting rate for Southern Boobook was 100.0% (eg grid number V27) and the minimum was 0.1% (eg grid number I11). 
Breeding map
Breeding - 2017
This map shows the breeding distribution of the Southern Boobook for 2017.
The red circles are the grid cells where breeding activity for Southern Boobook have been reported.
The size of the circle represents the number of reports. 
Breeding - all years
This map shows the breeding distribution of the Southern Boobook for all years.
The red circles are the grid cells where breeding activity for Southern Boobook have been reported.
The size of the circle represents the number of reports. 